Measurement should not only record outcomes.
It should model behavior.
One of the hardest questions I kept getting early on, especially when stakeholders had not set up pixels, events, or proper tagging, was deceptively simple: How do you know those sales came from the campaign?
We would run a mid-funnel campaign, a few creatives would spike in engagement, traffic would surge to the store, and purchases would follow. But purchases were also happening organically. The only “proof” was a convenient timing overlap, a bump in CRM revenue that happened to coincide with campaign dates. That was not attribution. It was coincidence dressed up as confidence.
As we started running multiple campaigns across low-, mid-, and high-ticket products, performance became erratic even when the UVP was clear and the messaging was disciplined. The lesson landed fast: you cannot optimize in silos when the measurement layer is missing.
I was not a coder. I avoided implementation and relied on others to make GA4 tell a coherent story, until the day that stopped being an option. Necessity did not just force effort. It forced ownership. That is where my marketing analytics journey actually began.
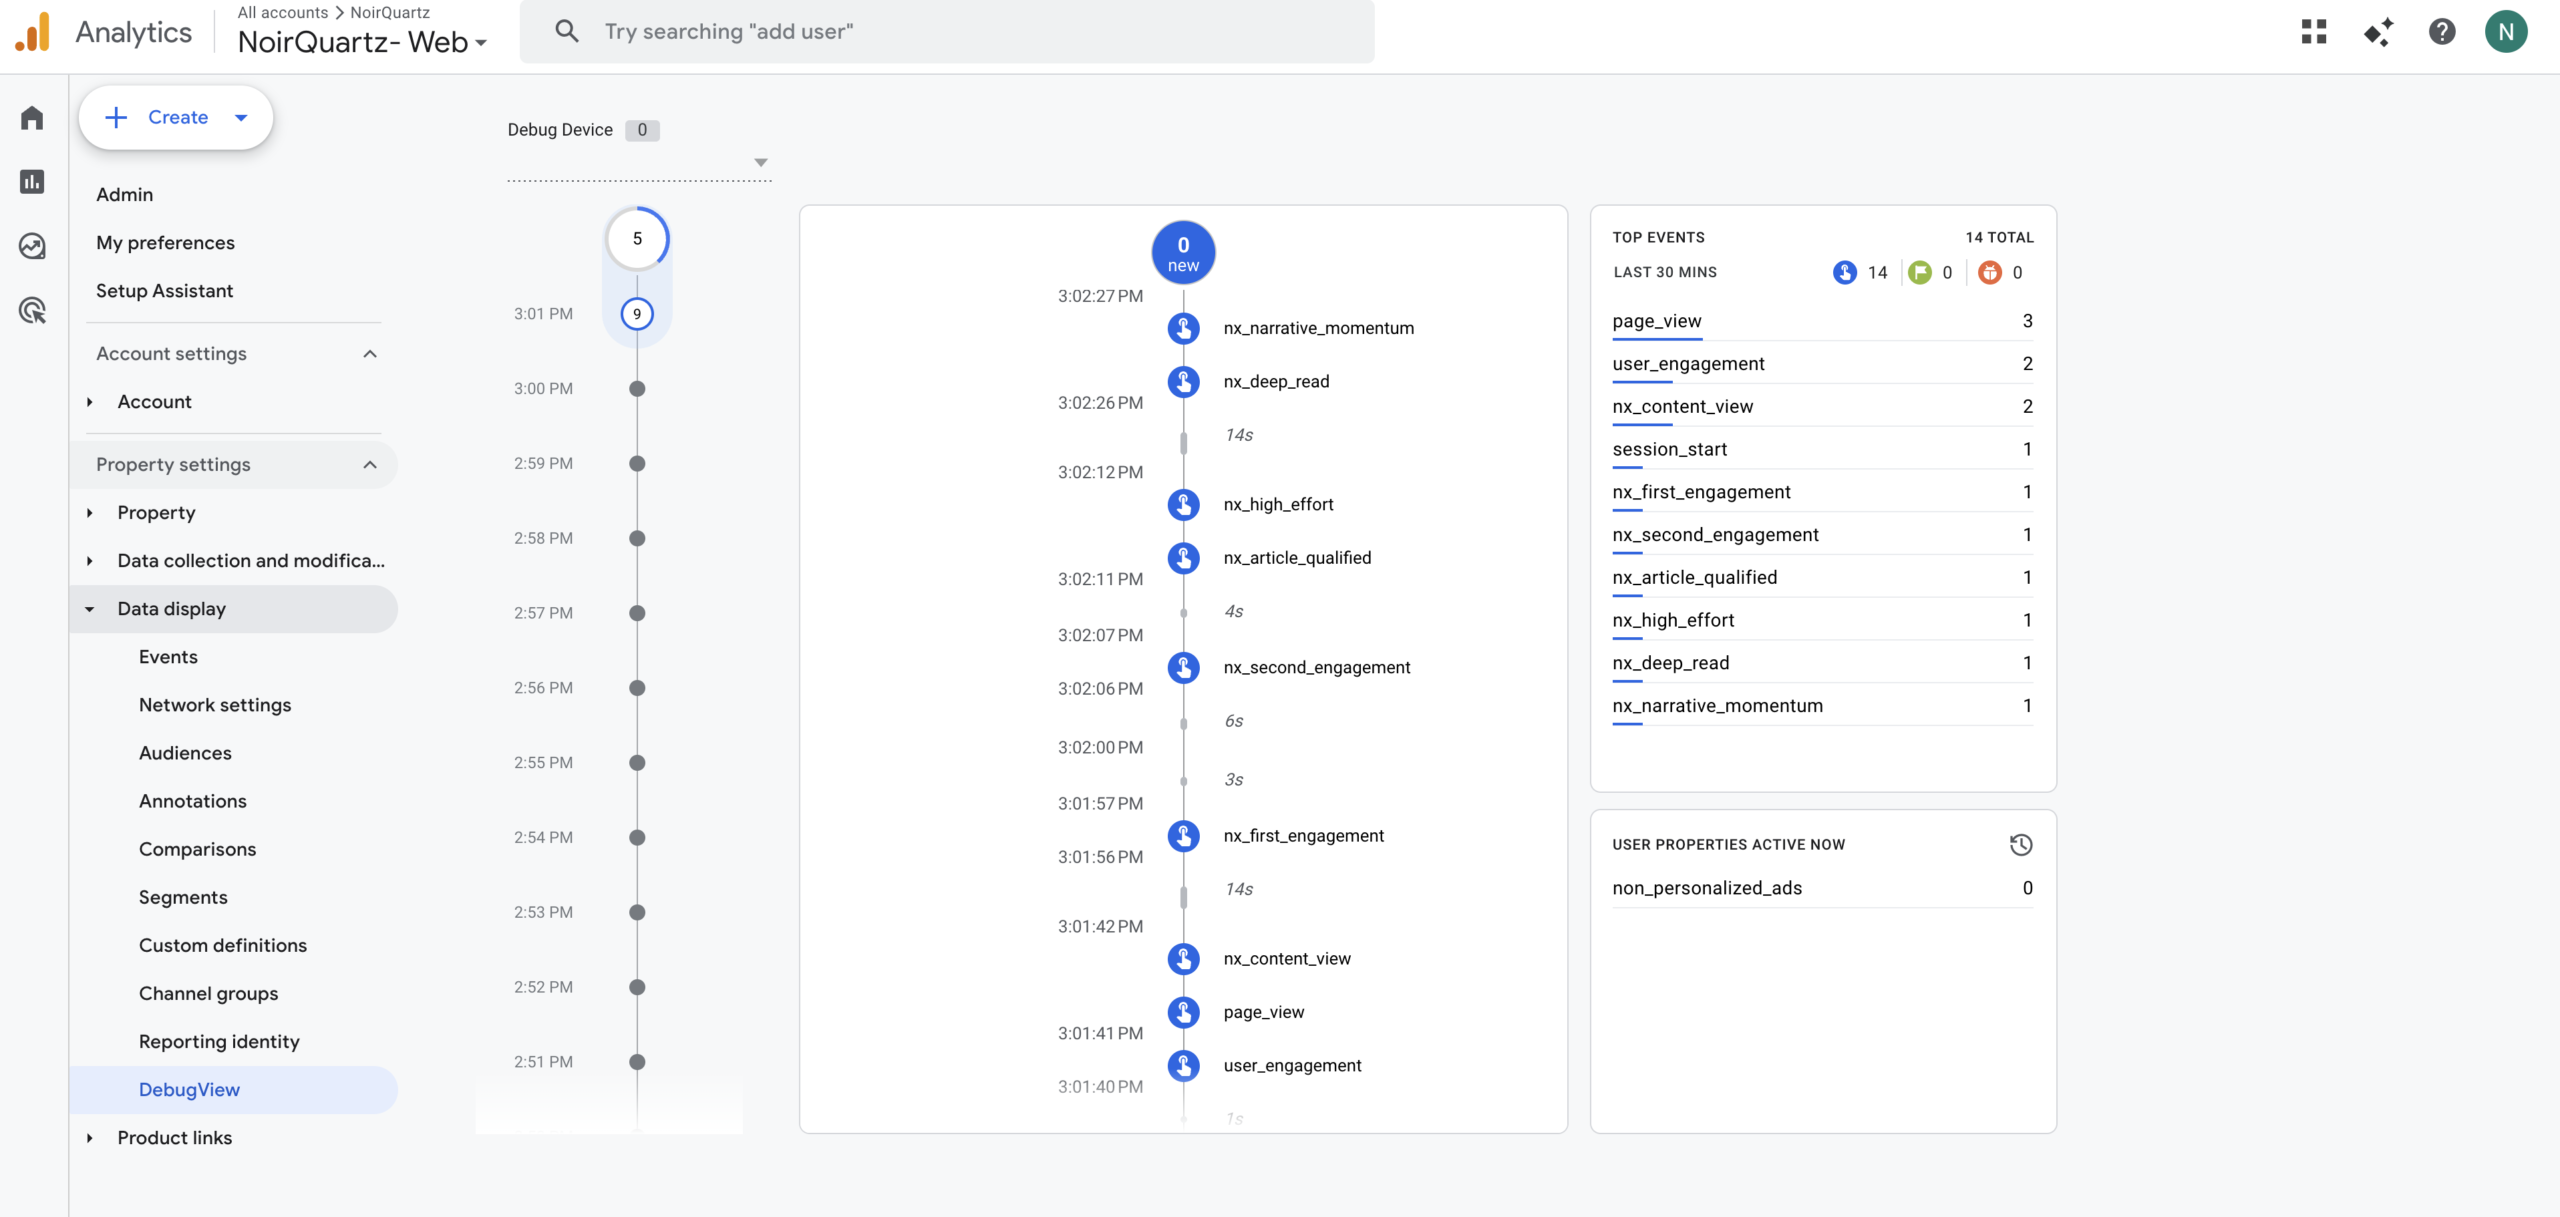
I have come a long way from measuring page views and add-to-carts to building logic that tries to capture something closer to reality: effort, intent, and commitment. Most analytics stacks illuminate final clicks and conversions, while most of the user journey remains dark. I operate with a simple heuristic: a large share of what drives outcomes happens before the obvious events ever appear on a standard dashboard.
This marketing analytics infrastructure was built around the actual traffic patterns and behavioral signals of this website. It demonstrates that, alongside standard measurements such as page views, add_to_cart, checkout, and purchase, we can also instrument deeper layers of user behavior that indicate intent and cognition.
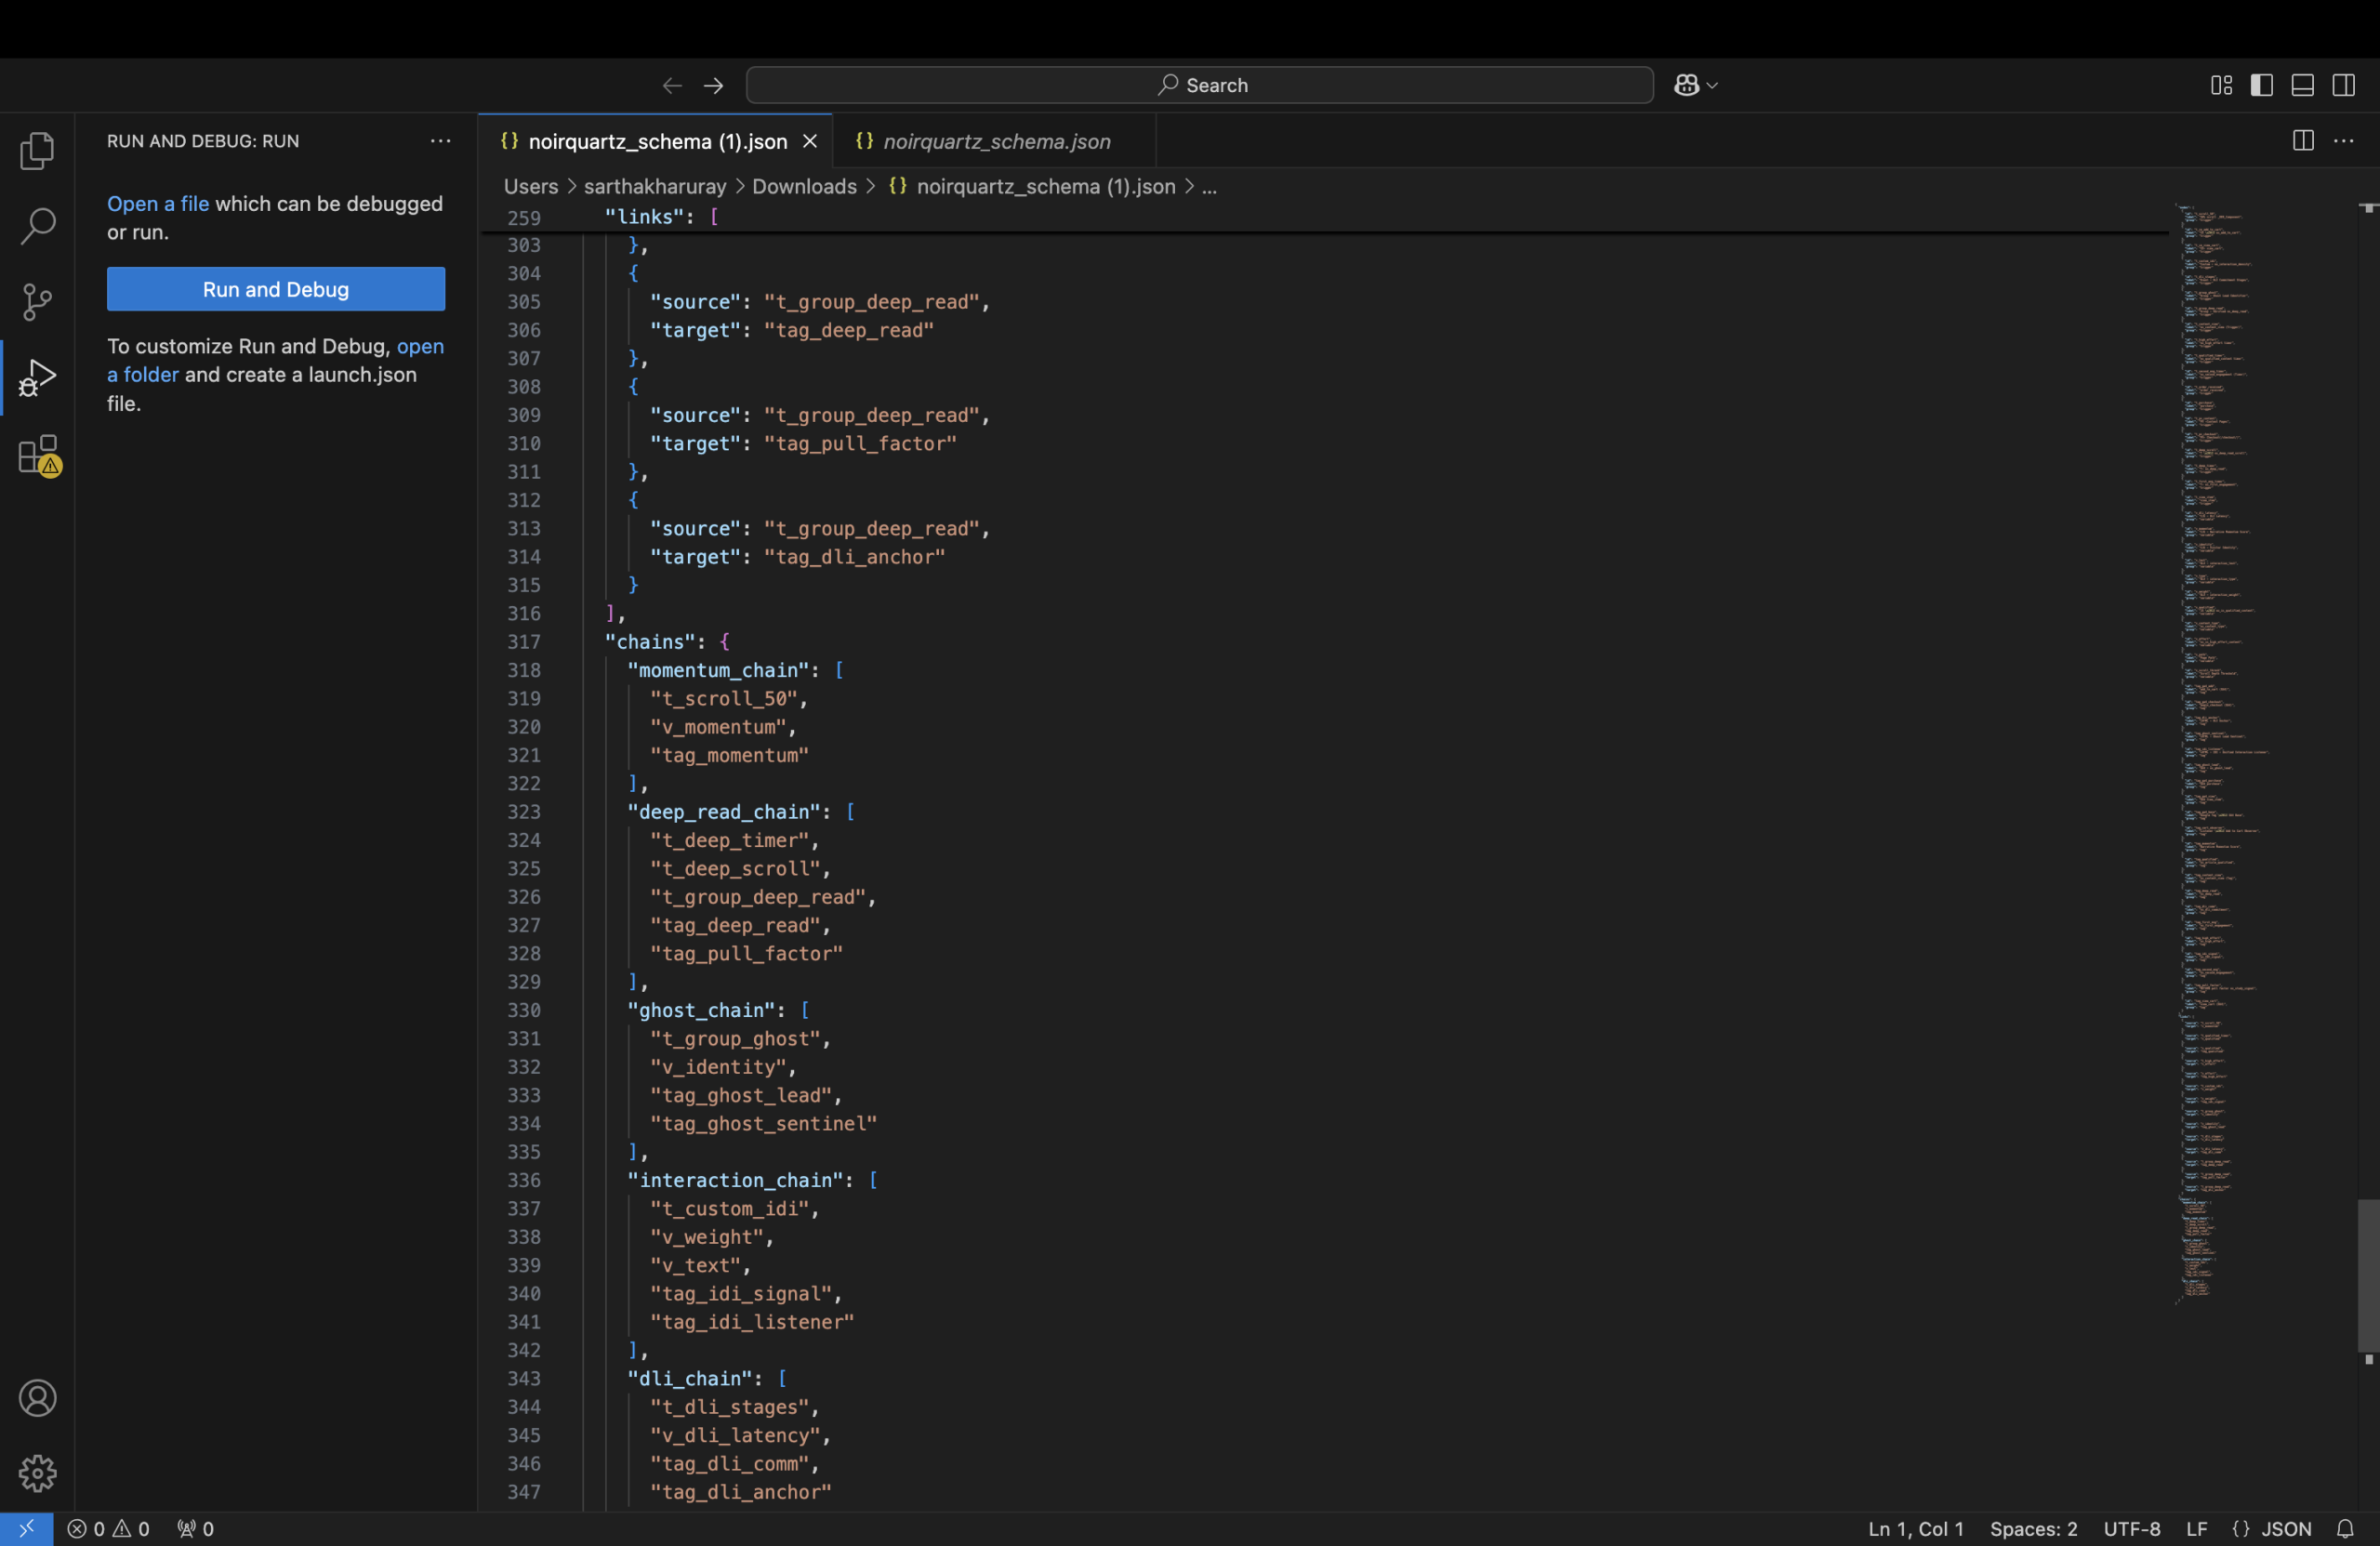
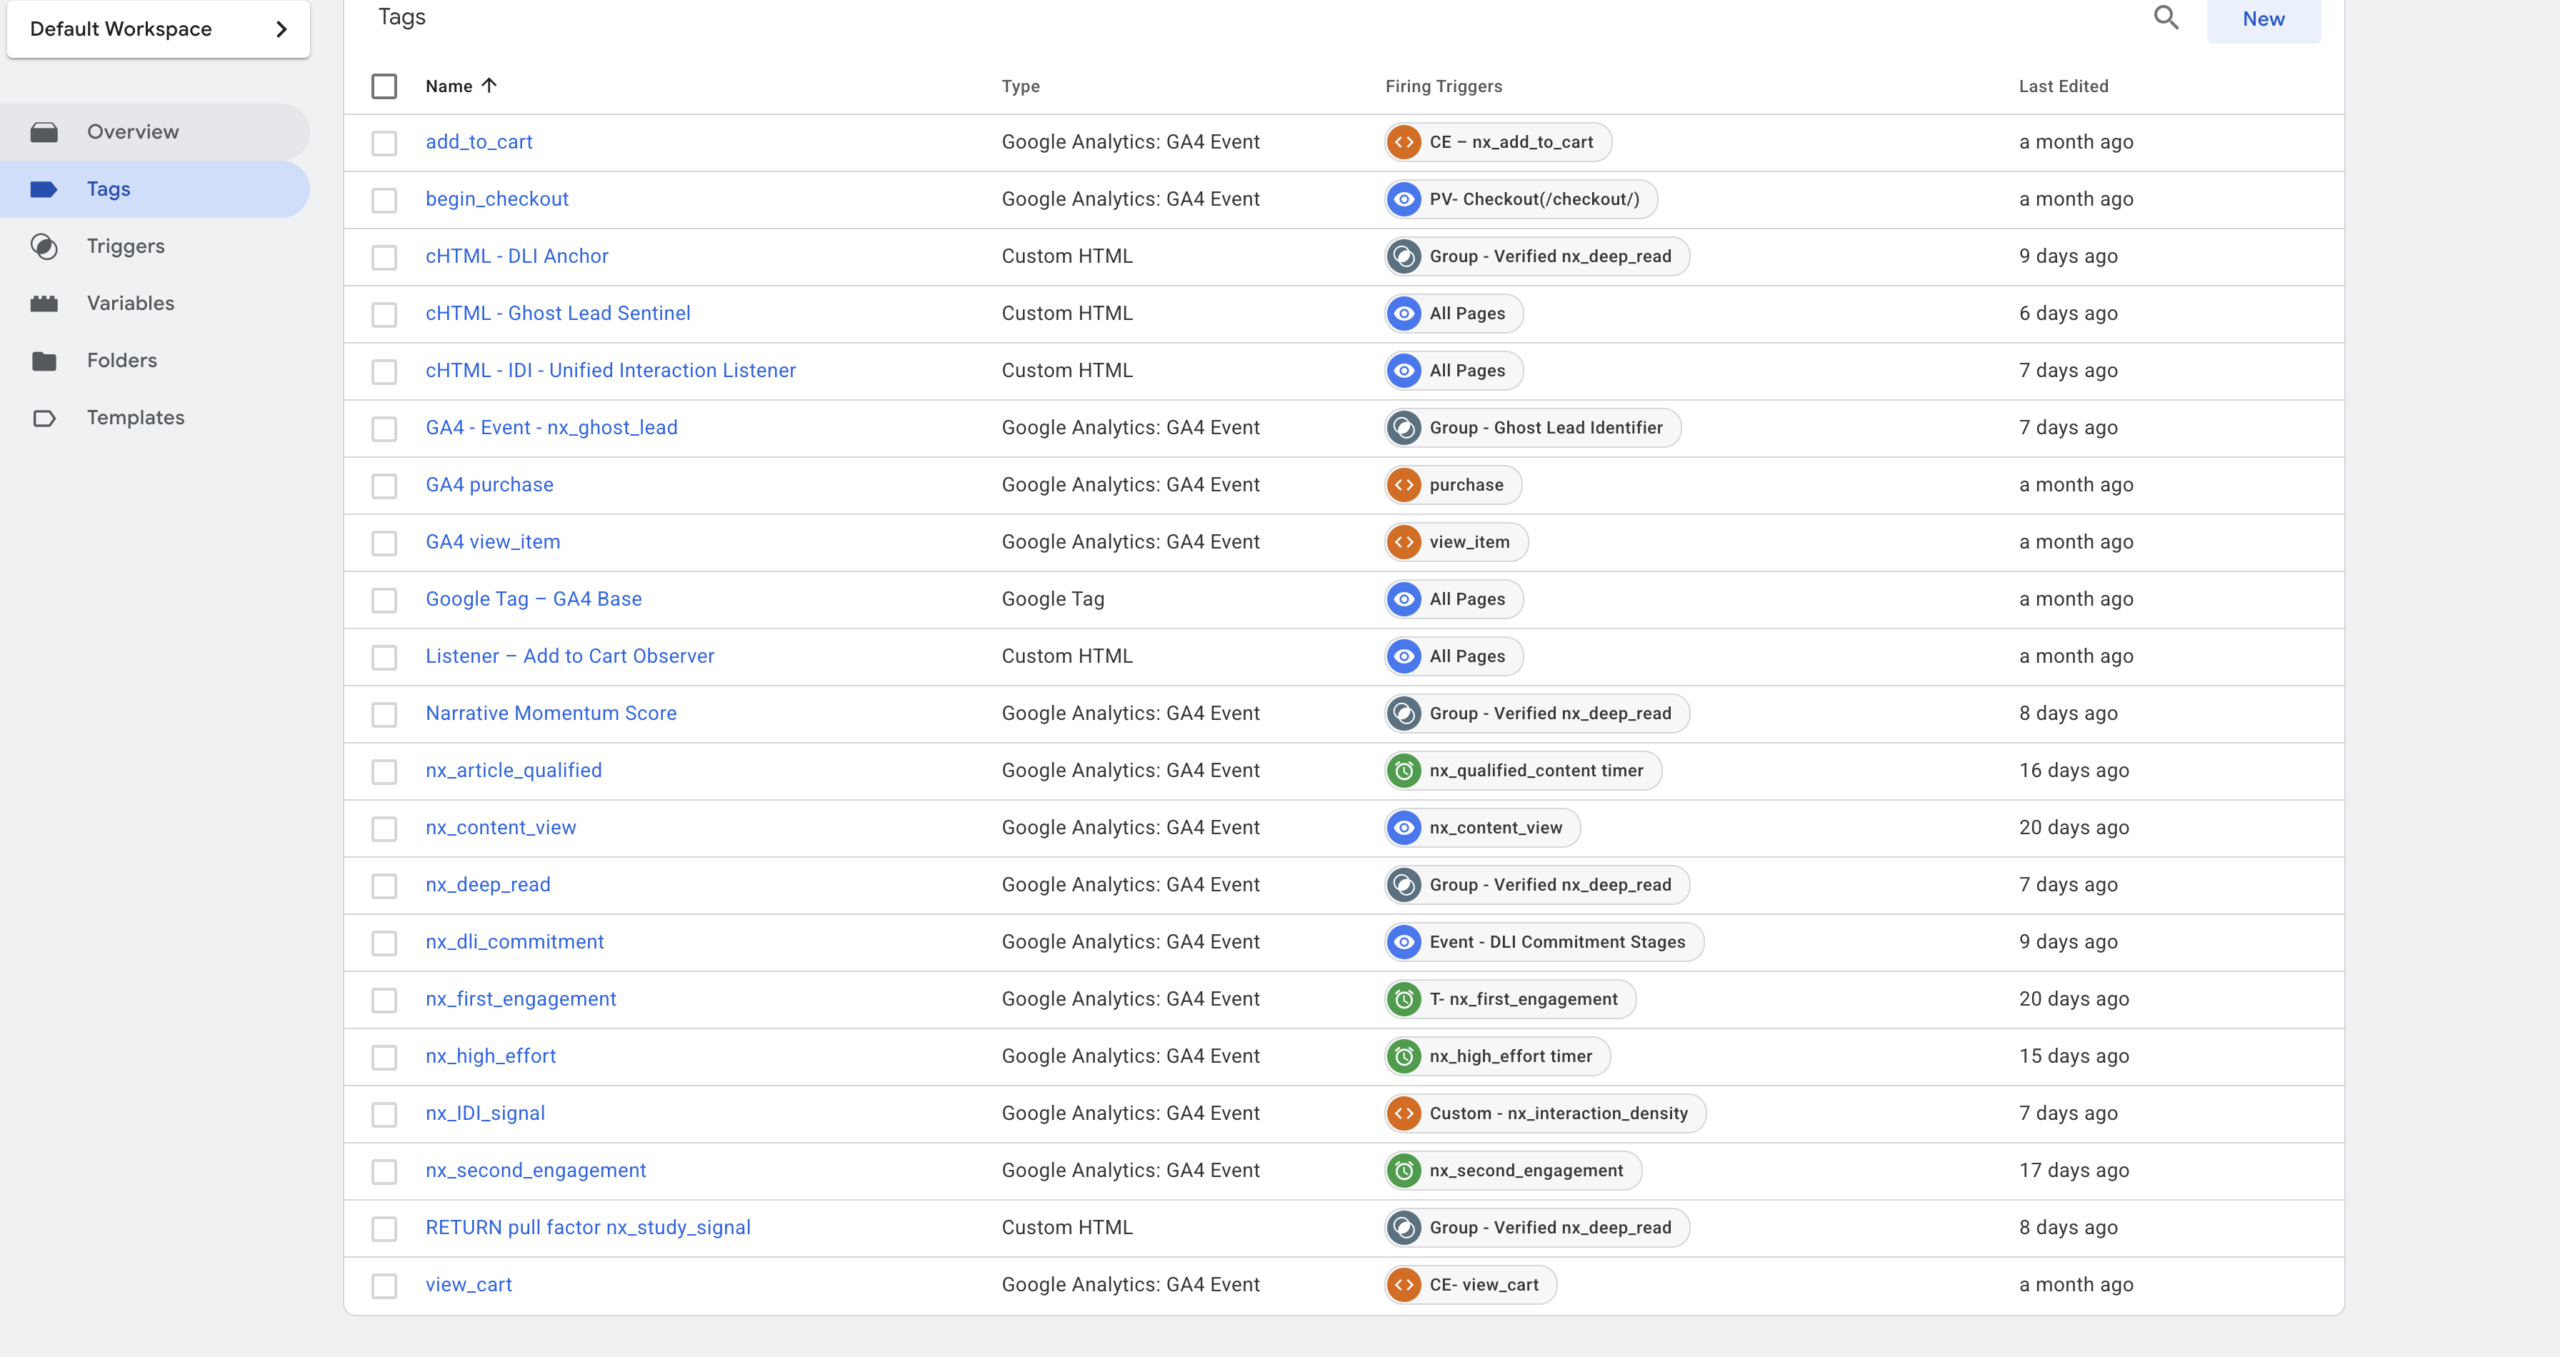
I designed a custom behavioral framework built on six non-standard measurement lenses: DLI, CSS, DER, CV, CGI, and RPF, supported by an event taxonomy that functions like a nervous system:
- Cognitive Outputs (tags): signals such as nx_deep_read, nx_high_effort, nx_article_qualified, nx_ghost_lead, and commerce events
- Sensory Gates (triggers): timers, thresholds, and stage conditions that determine when a behavior qualifies as meaningful
- Behavioral Listeners (variables + custom HTML): unified interaction capture that converts raw activity into interpretable signals
I also patched platform gaps where needed (for example, implementing a WooCommerce add-to-cart observer), enforced naming discipline across events, and documented debugging pitfalls so the system remains explainable, testable, and maintainable.
At the center of this infrastructure is Google Tag Manager, which holds the custom logic, listeners, tags, and triggers. Google Analytics 4 acts as the observation layer, where those signals become visible, analyzable, and decision-ready.
At the time of writing, this website is still new and does not yet receive significant traffic. Even so, I am genuinely excited to watch this measurement infrastructure run end-to-end and validate that the plumbing works without signal loss, event leakage, or reporting blind spots.
I have kept the analytics infrastructure deliberately simple, but powerful. The system is not over-engineered for unnecessary granularity or complexity. It is designed to be appropriate for the current scale of the website while still capturing the behavioral signals that matter.
If this were a live e-commerce operation handling high traffic volumes, I would extend the stack substantially, including a tighter integration with Meta Pixel (and likely Conversions API), stronger alignment with Google Ads measurement requirements, and a more resilient site architecture for attribution, experimentation, and performance at scale.
A large share of the behavioral logic used in this infrastructure is transferable to real e-commerce environments, regardless of whether traffic is currently low or high. The value of these measurements is not dependent on volume alone, but on whether they capture meaningful signals early enough to inform decisions.
For example, a signal like nx_ghost_lead can help identify high-intent visitors who show sustained interest but exit without purchasing. The reasons may vary, pricing hesitation, weak product-page clarity, checkout friction, trust gaps, or timing, but the signal helps isolate a cohort worth investigating and re-engaging. That creates a foundation for more surgical remarketing rather than broad, wasteful retargeting.
The custom Narrative Momentum Score can help gauge comparative product interest with more nuance than simple page-view counts or product-view ratios. It attempts to measure how attention develops across a session, not just whether a page was opened.
The Return Pull Factor (RPF) can help track whether and how users return to the store after initial exposure, making return behavior, drop-off patterns, and re-entry points easier to interpret. In practice, this can support better retention analysis, reduce slippage across the journey, and inform interventions aimed at improving customer lifetime value over time.
Without further ado lets get started with the Marketing Analytics Infrastructure.
The Mastery Cascade: A Holistic Progression
// hover any tile to preview its causal chain — click to lock it in the sidecar
I — The Spark: nx_content_view
Level: Peripheral Awareness
Role: Baseline entry. Not “a page view.” The system acknowledging entry into a High-Value Zone (technical project, manifesto, longform field note).
Cascade: Fires on render, activates the sensory layer, and puts the Ghost Sentinel on standby. Necessary precursor to everything else.
II — The Interpretive Signal: nx_IDI_signal (Interaction Density Index)
Level: Cognitive Friction Detected
Role: The first meaningful divider between passive presence and active processing. This is where the system starts to say: “This person isn’t just here. They’re working.”
Cascade: Calculated via variables and weighted logic. If IDI crosses threshold, the visit becomes eligible for promotion into “study behavior.”
III — The Filter: nx_high_effort + nx_momentum
Level: Behavioral Intent
Role: Measures persistence and rhythm.
Cascade: Too fast = skimmer | Too slow with no interaction = stalled | Sustained cadence + effort = promoted into “active study”. This is where momentum stops being a vanity metric and becomes a gate.
IV — The Defensive Layer: Ghost Lead Sentinel (nx_ghost_lead)
Level: Intent Preservation
Role: Insurance policy for high-resonance non-converters.
Cascade: If the system detects high effort and exit intent without a deep-read, the sentinel fires. It marks the user as a high-value ghost.
V — The Return: return_pull_factor + nx_study_signal
Level: Systemic Resonance
Role: Tracks gravitational pull across sessions.
Cascade: When a ghost returns, the system refuses to treat them as “new.” It fires nx_study_signal, proving return pull. This is authority measured as behavior, not vibes.
VI — The Summit: nx_deep_read
Level: Cognitive Capture
Role: Terminal event in the hierarchy. The culmination of view + IDI + effort + momentum. The moment a ghost becomes a student. The loop closes.
VII — The Conversion: purchase
Level: Economic Reality
Role: The final transaction. By the time this standard GA4 tag fires, the actual psychological work of persuasion (measured in steps I–VI) is already complete.
Cascade: The lagging indicator. Illuminated here not as the goal, but as the inevitable economic outcome of achieving cognitive capture.